Querying OpenShift Logs with LokiStack and Grafana
The previous post covered forwarding OpenShift logs to an external syslog server using the Logging Operator and a ClusterLogForwarder. That handles the durability problem — logs leave the cluster and land somewhere they can outlive it. This post adds the other half: querying and visualizing those same logs interactively inside the cluster using LokiStack and Grafana. The ClusterLogForwarder from the previous post gets a second output added, so syslog forwarding keeps working and Loki gets the same stream alongside it.
Why This Matters
Syslog gets your logs off the cluster. What it does not give you is a fast, interactive way to ask questions about them while you are debugging. Tailing a forwarded log file or writing a query against a SIEM is useful for forensics, not for active troubleshooting where you are iterating quickly.
LokiStack brings structured log querying into the cluster. You can filter by namespace, label, pod name, log level, or any combination — and because LokiStack runs in openshift-logging tenancy mode, it enforces OpenShift RBAC automatically. Users can only query logs from namespaces they already have access to.
Grafana connects to LokiStack as a datasource and gives you the Explore view: live log tailing, label-based filtering, and histogram overlays over time. It is worth slowing down to set this up properly — once it is in place, it changes how you investigate problems in the cluster.
The Steps
- Install the Red Hat Loki Operator into a dedicated namespace, and the community Grafana Operator into its own
- Provision an S3 bucket via OpenShift Data Foundation and deploy a LokiStack backed by it
- Deploy Grafana with a ServiceAccount that has the minimum permissions the LokiStack gateway requires
- Update the
ClusterLogForwarderto add LokiStack as a second output alongside syslog - Query logs in Grafana Explore
How To Do It
Step 1: Install the Operators
Two operators are needed: the Red Hat Loki Operator and the community Grafana Operator. If you want a primer on how OLM and operator installation works before diving in, How to Find, Install, and Explore an OpenShift Operator from the CLI is a good starting point.
The Grafana Operator installs namespace-scoped into its own dedicated namespace. Both are installed into dedicated namespaces rather than the default openshift-operators. The reasons for that are worth understanding — a dedicated post covering exactly why is coming soon.
This file creates six resources to install both operators:
Loki Operator Namespace, OperatorGroup, and Subscription
apiVersion: v1
kind: Namespace
metadata:
  name: loki-operator
---
apiVersion: operators.coreos.com/v1
kind: OperatorGroup
metadata:
  name: loki-operator-group
  namespace: loki-operator
spec: {}
---
apiVersion: operators.coreos.com/v1alpha1
kind: Subscription
metadata:
  name: loki-operator
  namespace: loki-operator
spec:
  channel: stable-6.5
  installPlanApproval: Automatic
  name: loki-operator
  source: redhat-operators
  sourceNamespace: openshift-marketplace
The Loki Operator needs “All Namespaces” install scope — it has to watch for LokiStack resources in any namespace across the cluster. spec: {} on the OperatorGroup (no targetNamespaces set) signals that. This gives the same watch scope as the global-operators group in openshift-operators, but the operator’s own lifecycle stays isolated to the loki-operator namespace. It manages LokiStack resources and deploys the gateway, compactor, and storage components.
Most operators publish a stable channel you can subscribe to without pinning a version. The Loki Operator does not — its channels are versioned, like stable-6.2 or stable-6.5. If you copy the channel name from this post and that version is no longer current, your Subscription will fail to resolve. Check what is actually available on your cluster before applying:
oc get packagemanifest loki-operator -o jsonpath='{.status.channels[*].name}'
Use whatever stable-x.x value comes back — that is the channel name to put in the Subscription.
Grafana Operator Namespace, OperatorGroup, and Subscription
apiVersion: v1
kind: Namespace
metadata:
  name: grafana-logging
---
apiVersion: operators.coreos.com/v1
kind: OperatorGroup
metadata:
  name: grafana-operator-group
  namespace: grafana-logging
spec:
  targetNamespaces:
  - grafana-logging
---
apiVersion: operators.coreos.com/v1alpha1
kind: Subscription
metadata:
  name: grafana-operator
  namespace: grafana-logging
spec:
  channel: v5
  installPlanApproval: Automatic
  name: grafana-operator
  source: community-operators
  sourceNamespace: openshift-marketplace
The Grafana Operator installs namespace-scoped into a dedicated grafana-logging namespace from the community catalog on channel v5. The OperatorGroup scopes it to that namespace — without one, the Subscription will stall.
oc apply -f 1-install-operators.yaml
Wait for both CSVs to reach Succeeded before moving on — do not continue until both show Succeeded:
This could take a minute show up
oc get csv -n loki-operator -w
oc get csv -n grafana-logging -w
NAME                       DISPLAY           VERSION   PHASE
loki-operator.v6.5.0       Loki Operator     6.5.0     Succeeded

NAME                          DISPLAY            VERSION   PHASE
grafana-operator.v5.x.x       Grafana Operator   5.x.x     Succeeded
Step 2: Deploy the LokiStack
LokiStack needs an S3-compatible object store to write log chunks. This can be any S3-compatible target — AWS S3, Google Cloud Storage, Azure Blob, MinIO, or anything else that speaks the S3 API. The LokiStack spec just needs an endpoint, bucket name, and credentials in a Secret. Since we have OpenShift Data Foundation available, we are using NooBaa, which is ODF’s built-in S3-compatible object store.
Two resources drive this step. You do not apply them directly — the script below handles them in the correct order. Read through them first so the script output makes sense.
ObjectBucketClaim
apiVersion: objectbucket.io/v1alpha1
kind: ObjectBucketClaim
metadata:
  name: logging-loki-bucket
  namespace: openshift-logging
spec:
  generateBucketName: logging-loki
  storageClassName: openshift-storage.noobaa.io
An ObjectBucketClaim is how you request a bucket from NooBaa. When this is created, the OBC controller provisions the bucket and writes the connection details — host, port, bucket name, and credentials — into a Secret and ConfigMap in the same namespace, both named after the OBC. Those values are not available until the OBC reaches Bound, which is why this cannot simply be applied as part of a single YAML file.
LokiStack
apiVersion: loki.grafana.com/v1
kind: LokiStack
metadata:
  name: logging-loki
  namespace: openshift-logging
spec:
  size: 1x.demo
  storage:
    schemas:
    - version: v13
      effectiveDate: "2024-10-01"
    secret:
      name: logging-loki-s3
      type: s3
  storageClassName: ocs-external-storagecluster-ceph-rbd
  tenants:
    mode: openshift-logging
size: 1x.demo is a single-replica layout appropriate for non-production clusters. tenants.mode: openshift-logging wires Loki directly into OpenShift RBAC — users can only query logs from namespaces they already have access to, with no additional tenant configuration needed. The secret.name: logging-loki-s3 is the Secret the script builds from the OBC credentials before this manifest is applied.
The Script
The script applies the two resources above in the correct sequence:
- Creates the
openshift-loggingnamespace if it does not already exist (idempotent — safe to run if the Logging Operator already created it) - Creates the
ObjectBucketClaimand waits for it to reachBound - Extracts
BUCKET_HOST,BUCKET_PORT,BUCKET_NAME,AWS_ACCESS_KEY_ID, andAWS_SECRET_ACCESS_KEYfrom the generated ConfigMap and Secret, then builds thelogging-loki-s3Secret the LokiStack references - Applies
3-lokistack.yamland waits for theReadycondition to beTrue
bash 2-lokistack-setup.sh
==> Creating namespace openshift-logging...
namespace/openshift-logging configured
==> Creating ObjectBucketClaim...
objectbucketclaim.objectbucket.io/logging-loki-bucket created
==> Waiting for OBC to bind...
  waiting...
  waiting...
==> Extracting S3 credentials...
==> Creating Loki S3 secret...
secret/logging-loki-s3 created
==> Deploying LokiStack...
lokistack.loki.grafana.com/logging-loki created
==> Waiting for LokiStack to be ready (this takes a few minutes)...
  waiting...
  waiting...
LokiStack is ready.
Confirm the LokiStack is fully ready before continuing:
oc get lokistack logging-loki -n openshift-logging
NAME           AGE    READY
logging-loki   3m     True
Then verify the gateway and storage pods are all running:
oc get pods -n openshift-logging -l app.kubernetes.io/instance=logging-loki
Step 3: Deploy Grafana
This file creates five resources in the grafana-logging namespace.
ServiceAccount
apiVersion: v1
kind: ServiceAccount
metadata:
  name: grafana-loki-sa
  namespace: grafana-logging
This is the identity Grafana uses when authenticating requests to the LokiStack gateway. The gateway validates the token via a TokenReview, then performs SubjectAccessReviews to check what the SA is allowed to see.
ClusterRole and ClusterRoleBinding
apiVersion: rbac.authorization.k8s.io/v1
kind: ClusterRole
metadata:
  name: grafana-loki-reader
rules:
- apiGroups: ["loki.grafana.com"]
  resources: ["application"]
  verbs: ["get"]
- apiGroups: [""]
  resources: ["namespaces", "pods"]
  verbs: ["get", "list"]
The LokiStack gateway (opa-openshift) performs two SubjectAccessReviews for every request:
- Tenant check —
get applicationin theloki.grafana.comAPI group.applicationis not a registered CRD; it is a virtual resource name the gateway uses to represent the application log tenant. RBAC evaluates rules for it correctly even though the resource doesn’t exist as a CRD. - Namespace check —
get podsin the namespace(s) referenced by the query labels. This enforces that the caller has actual Kubernetes-level access to the workloads whose logs they are reading.
Both checks must pass or the gateway returns You don't have permission to access this tenant.
Secret token
apiVersion: v1
kind: Secret
metadata:
  name: grafana-loki-token
  namespace: grafana-logging
  annotations:
    kubernetes.io/service-account.name: grafana-loki-sa
type: kubernetes.io/service-account-token
A long-lived token for the ServiceAccount. Kubernetes populates the token key automatically. The GrafanaDatasource reads it via valuesFrom and injects it as an Authorization header on every request to the LokiStack gateway.
Grafana and GrafanaDatasource
apiVersion: grafana.integreatly.org/v1beta1
kind: Grafana
metadata:
  name: logging-grafana
  namespace: grafana-logging
  labels:
    app: grafana
spec:
  route:
    spec: {}
  config:
    log:
      mode: "console"
    auth:
      disable_login_form: "false"
---
apiVersion: grafana.integreatly.org/v1beta1
kind: GrafanaDatasource
metadata:
  name: lokistack-datasource
  namespace: grafana-logging
spec:
  instanceSelector:
    matchLabels:
      app: grafana
  valuesFrom:
  - targetPath: "secureJsonData.httpHeaderValue1"
    valueFrom:
      secretKeyRef:
        name: grafana-loki-token
        key: token
  datasource:
    name: Loki
    type: loki
    access: proxy
    url: https://logging-loki-gateway-http.openshift-logging.svc.cluster.local:8080/api/logs/v1/application/
    isDefault: true
    jsonData:
      tlsSkipVerify: true
      httpHeaderName1: "Authorization"
      maxLines: 1000
    secureJsonData:
      httpHeaderValue1: "Bearer ${token}"
The datasource URL points directly at the LokiStack gateway’s internal service for the application log tenant. tlsSkipVerify: true is used here because we are connecting to an internal service using the cluster’s self-signed CA — in production you would mount the CA bundle instead.
oc apply -f 4-grafana.yaml
Verify the Grafana pod is running:
oc get pods -n grafana-logging -l app=logging-grafana
Confirm the datasource was successfully pushed to the Grafana instance:
oc get grafanadatasource lokistack-datasource -n grafana-logging \
  -o jsonpath='{.status.conditions[?(@.type=="DatasourceSynchronized")].message}'
Datasource was successfully applied to 1 instances
Step 4: Update the CLF to Dual-Output
This file replaces the ClusterLogForwarder from the previous post with a dual-output version, and adds a ClusterRoleBinding the collector needs to write to LokiStack.
ClusterLogForwarder
apiVersion: observability.openshift.io/v1
kind: ClusterLogForwarder
metadata:
  name: instance
  namespace: openshift-logging
spec:
  serviceAccount:
    name: logcollector

  inputs:
  - name: logspam-logs
    type: application
    application:
      includes:
      - namespace: logspam

  outputs:
  - name: syslog-out
    type: syslog
    syslog:
      url: tcp://rsyslog-service.syslog-server.svc.cluster.local:1514
      rfc: RFC5424
      enrichment: KubernetesMinimal

  - name: loki-out
    type: lokiStack
    lokiStack:
      target:
        name: logging-loki
        namespace: openshift-logging
      authentication:
        token:
          from: serviceAccount
    tls:
      ca:
        configMapName: openshift-service-ca.crt
        key: service-ca.crt

  pipelines:
  - name: app-to-all
    inputRefs:
    - logspam-logs
    outputRefs:
    - syslog-out
    - loki-out
The lokiStack output type references the LokiStack by name and namespace rather than a URL — the Vector collector handles service discovery, authentication, and TLS internally. authentication.token.from: serviceAccount tells the collector to use the logcollector ServiceAccount token when writing to Loki. The tls.ca block references the cluster’s internal CA bundle that OpenShift injects into every namespace automatically.
ClusterRoleBinding
apiVersion: rbac.authorization.k8s.io/v1
kind: ClusterRoleBinding
metadata:
  name: logcollector-write-application-logs
roleRef:
  apiGroup: rbac.authorization.k8s.io
  kind: ClusterRole
  name: cluster-logging-write-application-logs
subjects:
- kind: ServiceAccount
  name: logcollector
  namespace: openshift-logging
The logcollector ServiceAccount already has collect-application-logs from the previous post, which covers reading logs. Writing to LokiStack requires the separate cluster-logging-write-application-logs ClusterRole, installed by the Logging Operator.
oc apply -f 5-clf-dual-output.yaml
Confirm the CLF reconciled cleanly and both outputs are healthy:
oc get clusterlogforwarder instance -n openshift-logging \
  -o json | jq '.status'
Verify syslog is still receiving logs from the second output:
oc logs -n syslog-server -l app=rsyslog-server --tail=5
You should see recent structured syslog entries from the logspam namespace still arriving as before.
Then confirm Loki is ingesting. Vector does not log individual Loki requests at its default log level, so the reliable signal is querying the Loki labels API directly:
LOKI_ROUTE=$(oc get route logging-loki -n openshift-logging -o jsonpath='{.spec.host}')
TOKEN=$(oc whoami -t)
curl -sk -H "Authorization: Bearer $TOKEN" \
  "https://${LOKI_ROUTE}/api/logs/v1/application/loki/api/v1/labels" | jq .
Expected output:
{
  "status": "success",
  "data": [
    "k8s_container_name",
    "k8s_namespace_name",
    "k8s_node_name",
    "k8s_pod_name",
    "log_type",
    "openshift_log_type"
  ]
}
If data is an empty array, the collector has not pushed anything yet — wait 30 seconds and retry.
Step 5: Query Logs in Grafana
bash 6-get-grafana-url.sh
The Grafana Operator creates an admin credentials secret automatically named logging-grafana-admin-credentials. The script reads the route and pulls the username and password from that secret directly:
========================================
  Grafana Login Details
========================================
URL:      https://logging-grafana-route-grafana-logging.apps.example.com
Username: admin
Password: <generated-password>
========================================
Open the URL in a browser and log in. Use the Explore view from the left sidebar (the compass icon) — do not use the Explore Logs app. The Explore Logs app calls a detected_labels endpoint that the LokiStack gateway does not proxy, which causes 404 errors. The standard Explore view works correctly with LokiStack.
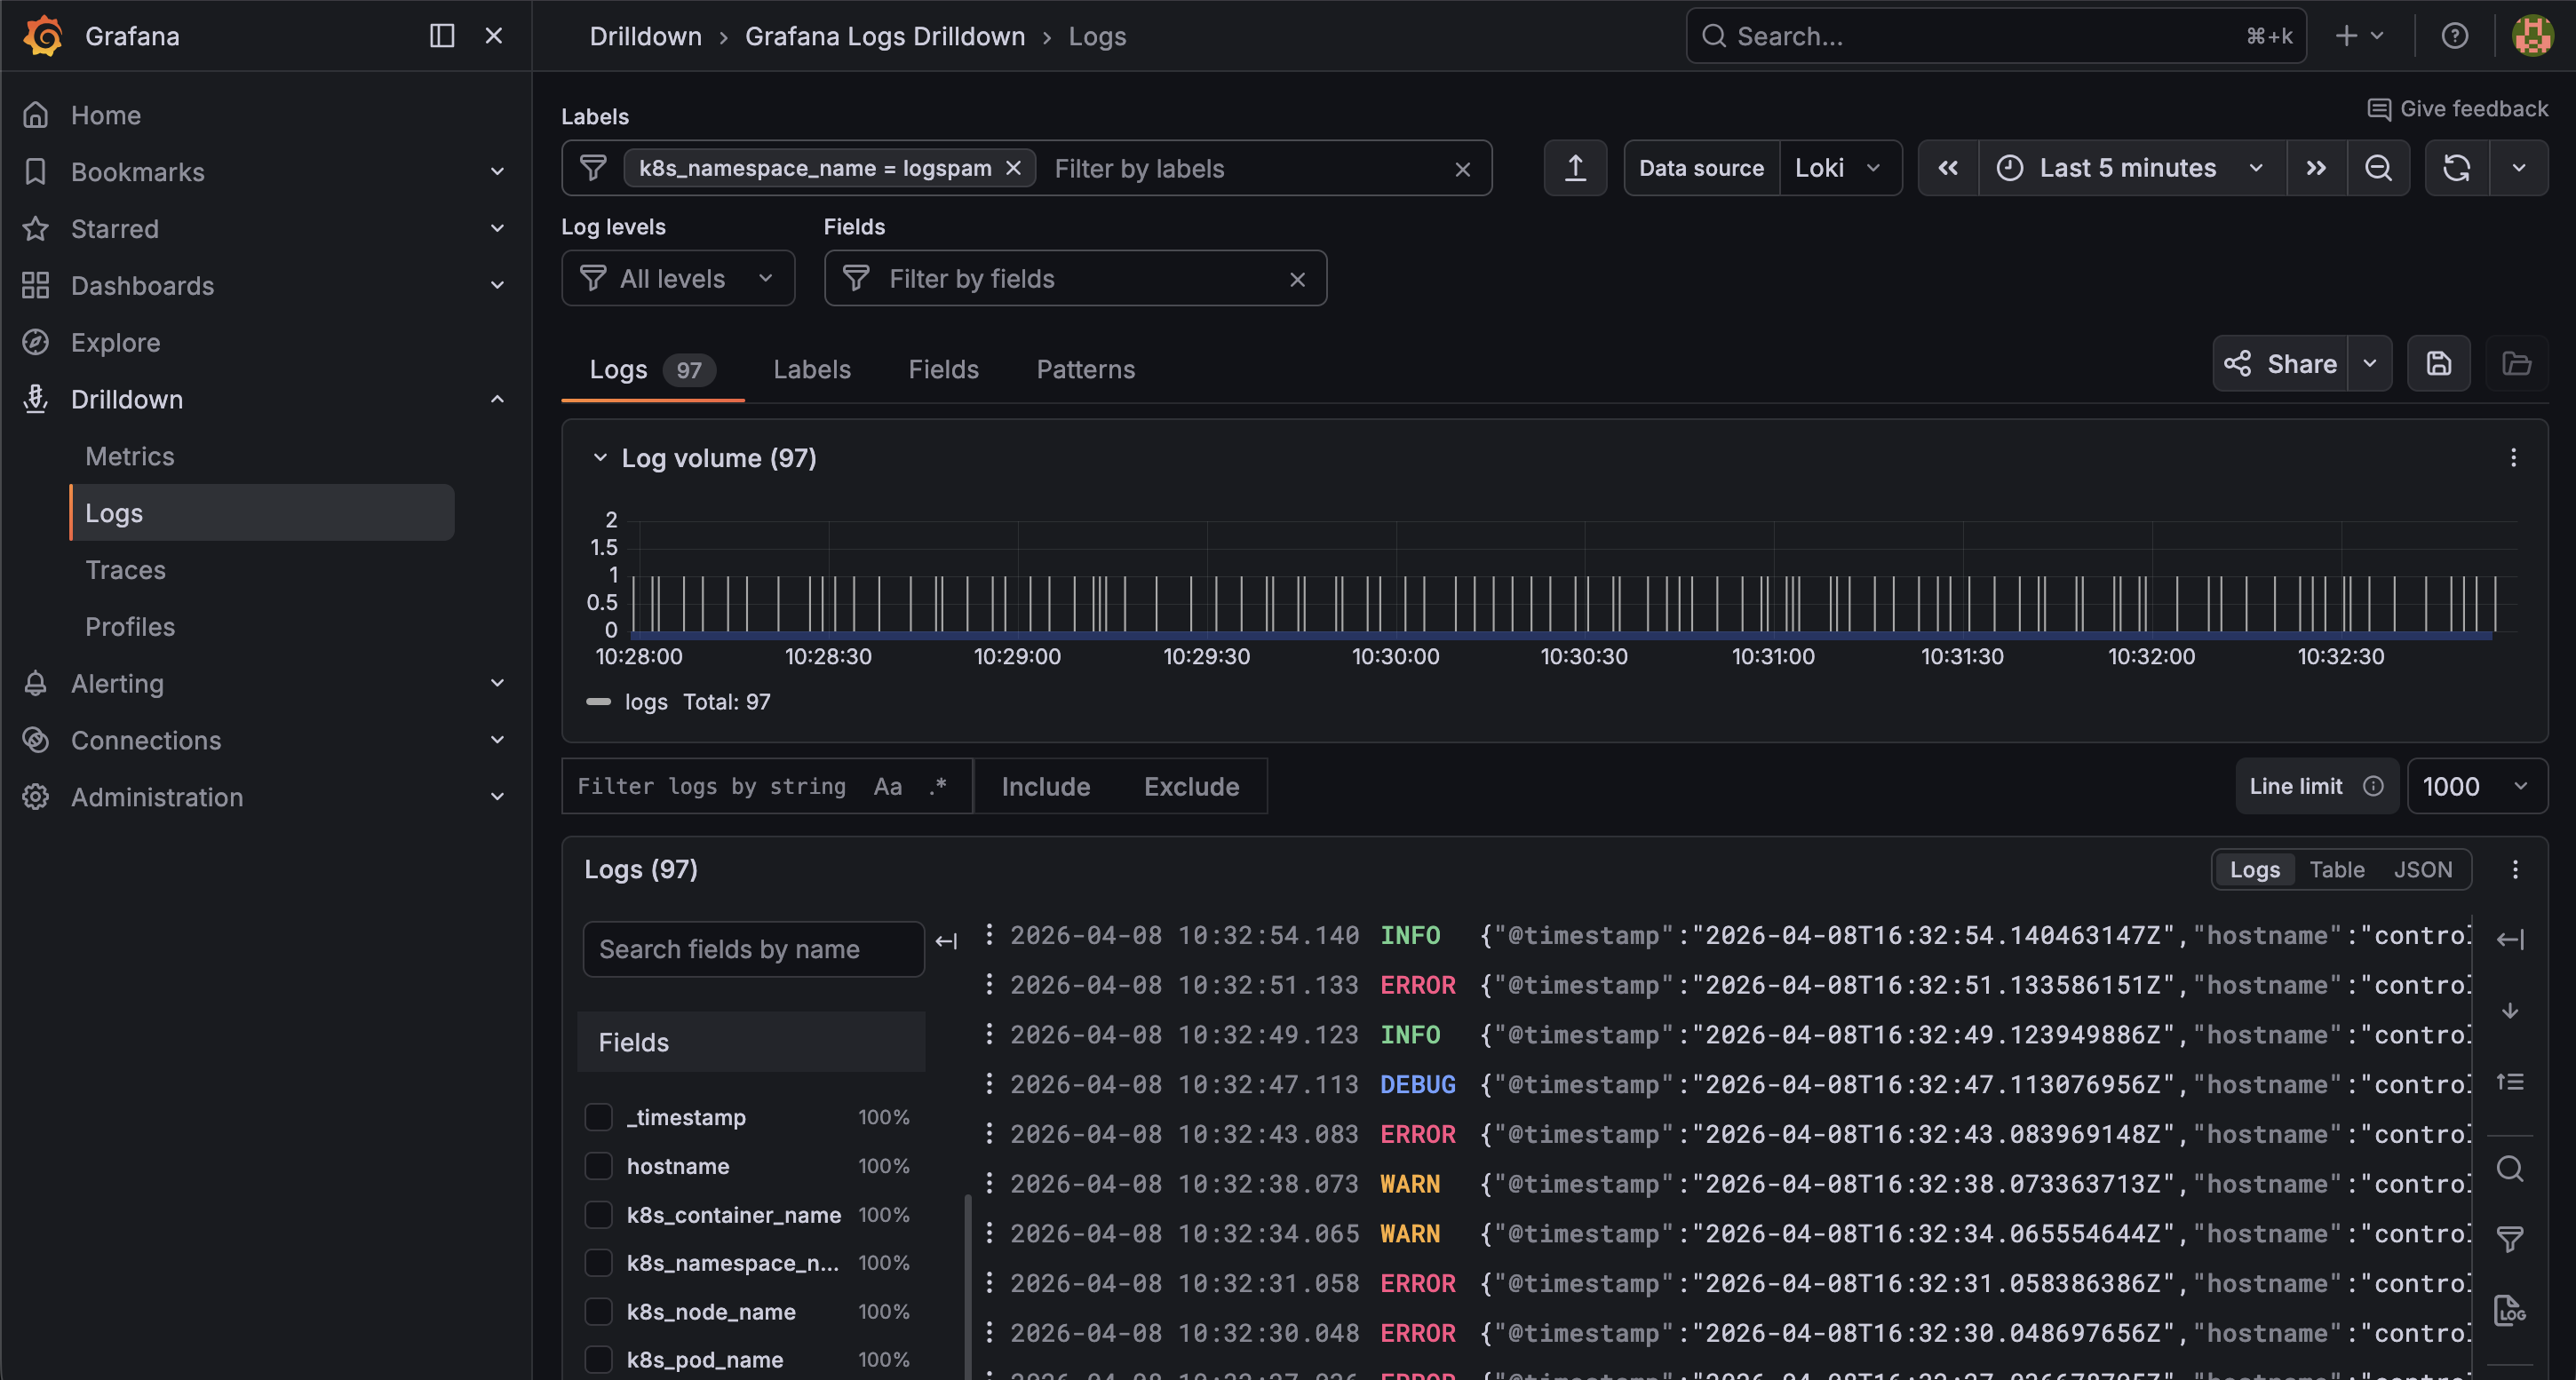
Select the Loki datasource and query:
{kubernetes_namespace_name="logspam"}
You will see the same log stream from the logspam generator — timestamped, color-coded by log level, and filterable by label or field.
The syslog server is receiving the same stream in parallel. Both outputs are driven by the same ClusterLogForwarder pipeline — add more outputs to fan logs to additional destinations without touching your workloads.